How long does it take to charge an electric car?
Battery size divided by charger power gives the ideal time. Everything that makes real charging slower is predictable, and most of it is not the charger.
Published 23 August 2026 · Published by SnapEnergyLab. Methodology and default assumptions are documented separately.
Quick answer
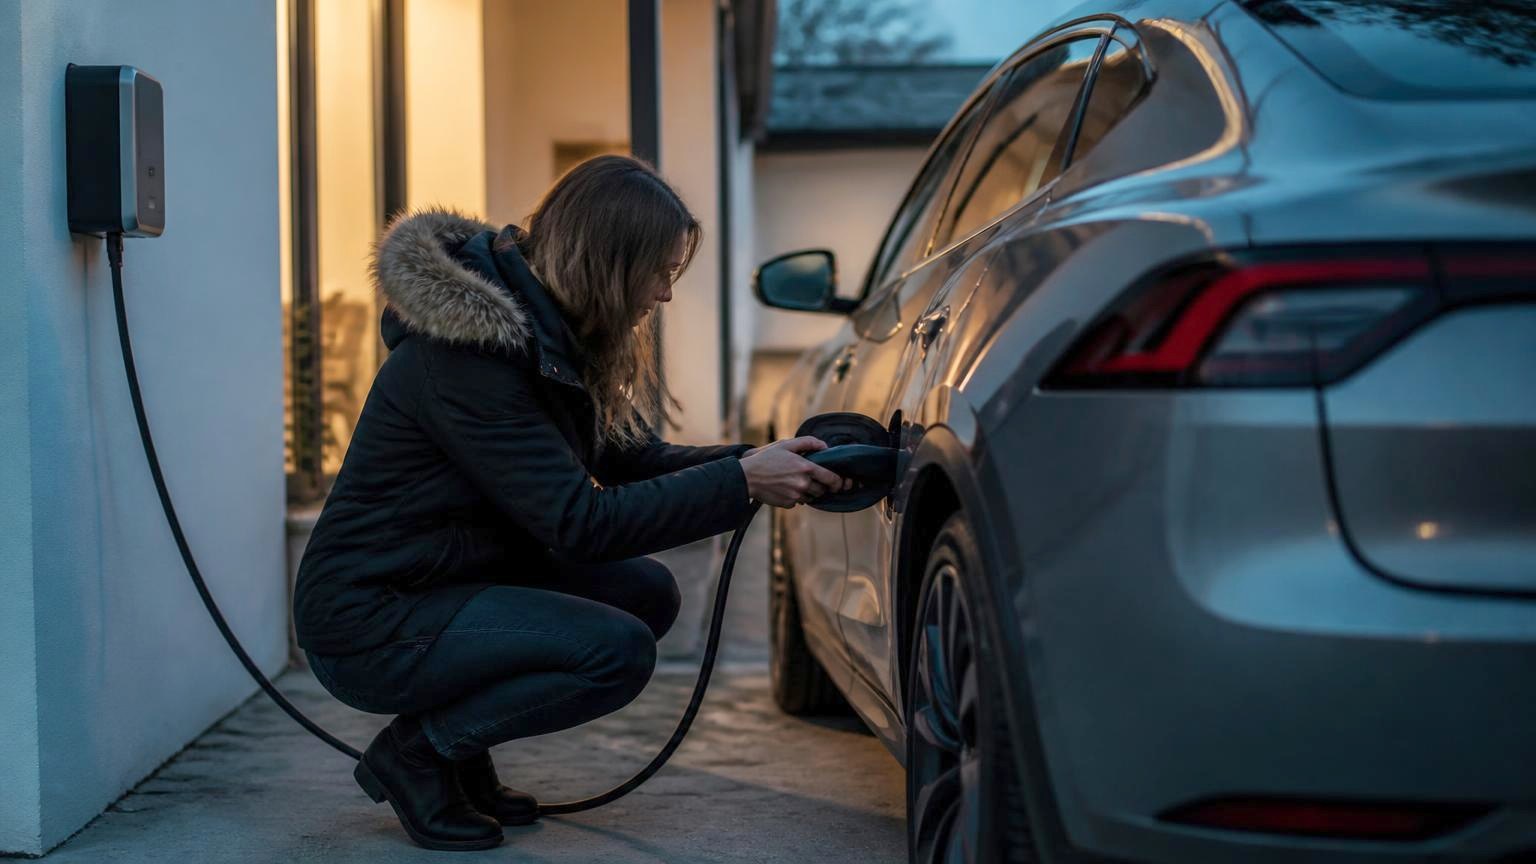
Charging time is battery size divided by charging power, divided again by charging efficiency. On a 7.4 kW home wallbox, a 60 kWh car goes from empty to full in about nine hours. On an 11 kW three-phase wallbox, about six hours. On a 150 kW rapid charger, 10 to 80% takes roughly half an hour.
Three things decide the actual figure: the charger’s power, the car’s own limit — its onboard charger on AC, its battery management on DC — and how much of the pack you are actually filling. The lower of the charger and car limits always wins.
- 7.4 kW home, 60 kWh pack
- ≈ 9 h 00 m
- Calculated result
- 11 kW home, 60 kWh pack
- ≈ 6 h 04 m
- Calculated result
- 150 kW DC, 10→80%
- ≈ 25 – 35 min
- Illustrative model
- AC charging efficiency
- ≈ 90%
- Site default
The formula
- energy needed (kWh) = battery capacity × (target SoC − starting SoC)
- charging power (kW) = min(charger output, vehicle acceptance limit)
- time (h) = energy needed ÷ (charging power × efficiency)
- 60 kWh × (0.80 − 0.20) = 36 kWh needed
- min(7.4 kW, 11 kW) = 7.4 kW
- 36 ÷ (7.4 × 0.90) = 5.41 h ≈ 5 h 24 m
Efficiency belongs in the denominator: the wall has to supply more energy than the pack receives, so losses make charging take longer, not shorter.
Charging time by battery size and charger power
Times below are a full 0→100% AC charge including 10% charging losses. They assume the car can accept the charger’s full output — check your onboard charger rating before trusting the 11 and 22 kW columns.
| Charging point | Power | 40 kWh | 60 kWh | 77 kWh | 100 kWh |
|---|---|---|---|---|---|
| Domestic socket, 10 A | 2.3 kW | 19 h 19 m | 28 h 59 m | 37 h 12 m | 48 h 19 m |
| Home wallbox, 1-phase 16 A | 3.7 kW | 12 h 01 m | 18 h 01 m | 23 h 07 m | 30 h 02 m |
| Home wallbox, 1-phase 32 A | 7.4 kW | 6 h 00 m | 9 h 01 m | 11 h 34 m | 15 h 01 m |
| Home wallbox, 3-phase 16 A | 11 kW | 4 h 02 m | 6 h 04 m | 7 h 47 m | 10 h 06 m |
| 3-phase 32 A | 22 kW | 2 h 01 m | 3 h 02 m | 3 h 53 m | 5 h 03 m |
DC rapid charging is deliberately absent from that table, because a 0→100% DC time is a fiction: the rate falls away long before the pack is full, and nobody charges to 100% on a rapid charger by choice. DC sessions are quoted 10→80% for that reason.
What each charging point actually gives you
| Charging point | Power | Practical note |
|---|---|---|
| Domestic socket, 10 A | 2.3 kW | Slow trickle. Losses are proportionally highest here. |
| Home wallbox, 1-phase 16 A | 3.7 kW | Common single-phase entry-level wallbox. |
| Home wallbox, 1-phase 32 A | 7.4 kW | The standard UK/1-phase home charger. |
| Home wallbox, 3-phase 16 A | 11 kW | Standard 3-phase home charger. Needs an 11 kW onboard charger. |
| 3-phase 32 A | 22 kW | Only useful if the car's onboard charger accepts 22 kW. Most do not. |
| DC rapid | 50 kW | Bypasses the onboard charger. Tapers above roughly 80%. |
| DC ultra-rapid | 150 kW | Peak rate held only over part of the curve. |
Worked example: an overnight top-up
- Battery capacity77 kWhYour input
- Arrive home at28% state of chargeYour input
- Charge to80% (daily limit)Your input
- Energy into the pack77 × 0.52 = 40.0 kWhCalculated result
- Wallbox7.4 kW, car accepts 11 kW → 7.4 kWCalculated result
- Energy drawn at the wall (90%)40.0 ÷ 0.90 = 44.5 kWhCalculated result
- Time44.5 ÷ 7.4 = 6.01 hCalculated result
Why DC rapid charging slows down
A 150 kW charger does not deliver 150 kW for the whole session. The battery management system requests a current the cells can accept safely, and that request falls as the pack fills — the charging curve, or taper. Advertised peak power is usually held for a short window in the lower half of the pack.
This is why rapid sessions are quoted 10→80%. The last 20% can take as long as the first 70%, which is why the practical road-trip strategy is short frequent stops in the fast part of the curve rather than one long stop to full.
Show the plotted values
| State of charge | Delivered power |
|---|---|
| 10% | 148 |
| 20% | 150 |
| 30% | 145 |
| 40% | 132 |
| 50% | 118 |
| 60% | 100 |
| 70% | 80 |
| 80% | 58 |
| 90% | 34 |
| 95% | 22 |
Five reasons a real charge takes longer than the calculation
1. Charging losses
AC charging is roughly 85–93% efficient. Conversion in the onboard charger, the battery’s own internal resistance and thermal management all consume energy at the wall that never reaches the pack. On a slow 2.3 kW socket, standby overheads are a larger share and efficiency is worse.
2. Cold batteries
A cold pack accepts current slowly. In winter a rapid charge can start well below the charger’s rating while the car warms the battery — sometimes spending several kW on heating alone. Cars with route-planner preconditioning warm the pack on approach for exactly this reason.
3. Taper near full
Above roughly 80% the rate falls sharply on DC, and even on AC the final few percent are managed more slowly while cells are balanced.
4. Shared and derated chargers
Two cars on a split rapid unit each get part of the total. Public units also derate in high ambient temperatures, and site supply limits can cap several posts collectively.
5. Cable and supply limits
A granny cable at 10 A, a wallbox configured down to protect a small main fuse, or dynamic load management reducing output while the oven is on — all cap real power below the nameplate figure.
Work out the time for your own car
Enter battery size, starting and target state of charge, and charger power. The calculator shows both energy into the pack and energy drawn at the wall, so the effect of charging losses stays visible.
Open the EV charging time calculatorAssumptions and limitations
- AC times assume 90% charging efficiency. Real efficiency ranges from about 85% on a domestic socket to about 93% on a well-matched wallbox.
- Vehicle acceptance limits vary by model and sometimes by trim. Check the onboard charger rating in the vehicle handbook before assuming an 11 or 22 kW AC rate.
- The DC curve shown is illustrative of typical behaviour, not a measurement of any specific vehicle, and it changes materially with battery temperature and state of health.
- Public charging is subject to site supply limits, power sharing between posts and thermal derating; the advertised rating of a post is an upper bound.
Sources
- IEC 61851-1 — Electric vehicle conductive charging system, general requirements — International Electrotechnical Commission
Supports: Definition of AC charging modes and the role of the vehicle's onboard charger in setting the AC rate.
- IEC 62196 — Plugs, socket-outlets and vehicle couplers for conductive charging — International Electrotechnical Commission
Supports: Current ratings behind the 3.7 / 7.4 / 11 / 22 kW AC power levels used in the table.
- Charging behaviour and efficiency of light-duty electric vehicles — Idaho National Laboratory, US Department of Energy
Supports: Measured AC charging efficiency in the high-80s to low-90s percent, and observed DC taper behaviour.
Related guides
 EV chargingCharging slows at 80%The taper is not a fault and not a marketing limit. It is what a lithium cell requires as it fills.
 EV chargingAC vs DC chargingYou pay for energy at the wall. Your car reports energy in the pack. Those are never the same number.
 EV chargingEV efficiency unitsThree units, three regions, one physical quantity — and one of them runs the wrong way round.