Why EV charging slows down after 80%
The taper is not a fault and not a marketing limit. It is what a lithium cell requires as it fills.
Published 23 August 2026 · Published by SnapEnergyLab. Methodology and default assumptions are documented separately.
Quick answer
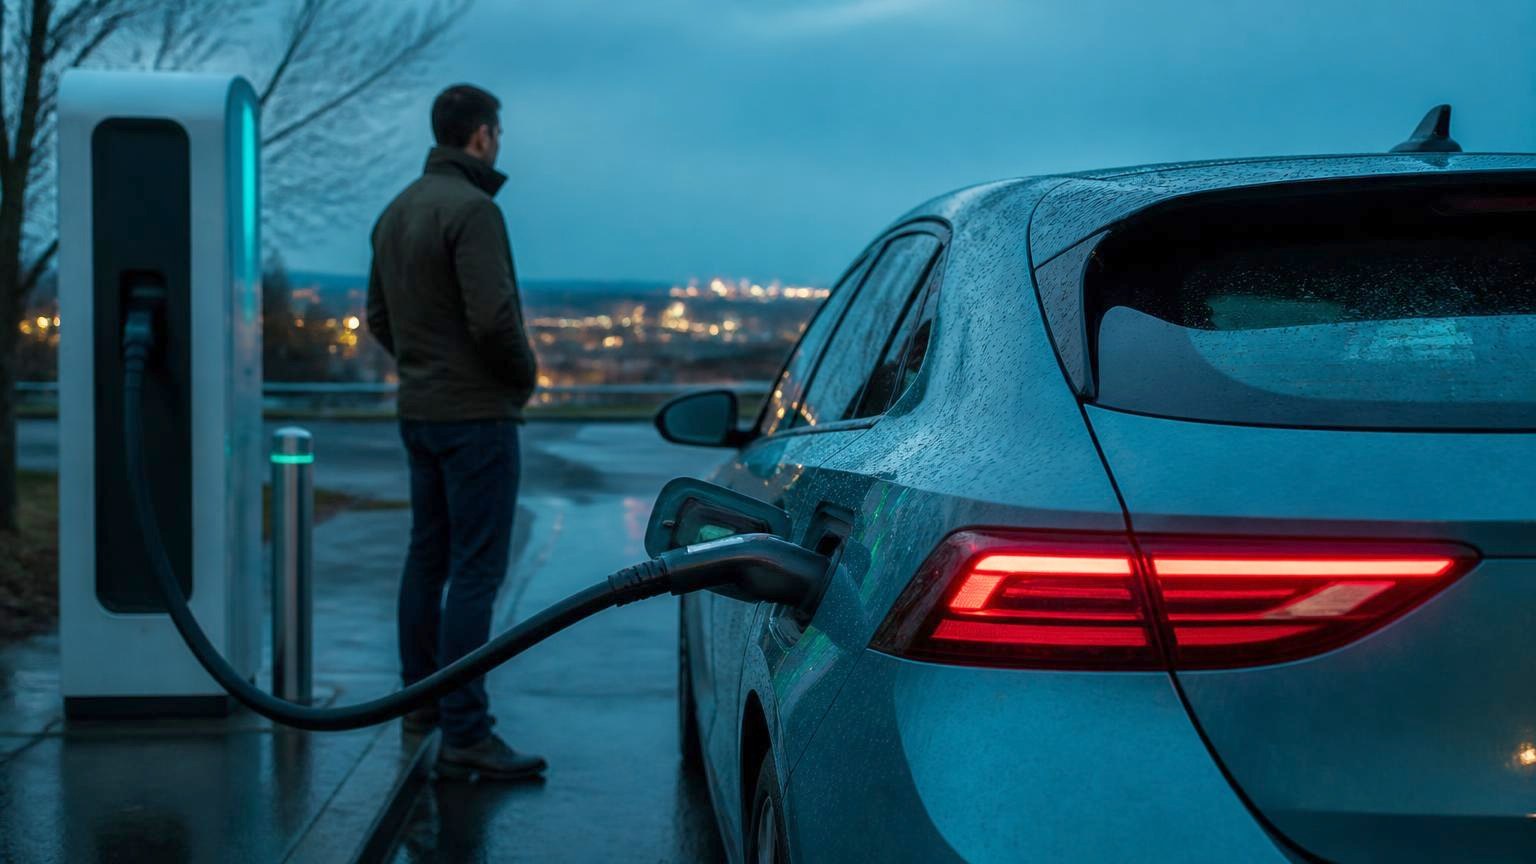
Charging slows because the battery asks it to. As cells fill, their voltage rises and the safe charging current falls — pushing more would plate lithium onto the anode and permanently damage the pack.
The practical consequence is stark: the last 20% of a charge often takes longer than the first 70%. On a journey, leaving at 80% and stopping again is usually faster than waiting for a full battery.
- 10 → 80%
- ≈ 25 min
- Illustrative model
- 80 → 100%
- ≈ 35 min
- Illustrative model
- Energy added
- 54 kWh vs 15 kWh
- Calculated result
What is happening inside the cell
Charging drives lithium ions into the graphite anode. Early in a charge the anode has plenty of space and can absorb ions quickly. As it fills, the remaining sites are harder to reach, cell voltage climbs towards its limit, and the rate at which ions can safely intercalate drops.
Push current beyond that rate and ions deposit as metallic lithium on the anode surface instead of entering it. That is lithium plating: it permanently removes capacity, and the resulting dendrites are a safety hazard. The battery management system prevents it by commanding progressively lower current.
Heat is the second limit. Charging generates heat proportional to current squared times internal resistance. A pack that is already warm from fast charging, or from a hard drive to the charger, has less thermal headroom and will taper earlier.
Show the plotted values
| State of charge | Charging power |
|---|---|
| 5% | 150 kW |
| 10% | 165 kW |
| 20% | 170 kW |
| 30% | 160 kW |
| 40% | 140 kW |
| 50% | 120 kW |
| 60% | 100 kW |
| 70% | 80 kW |
| 80% | 55 kW |
| 90% | 30 kW |
| 95% | 18 kW |
| 100% | 7 kW |
Why the last 20% costs so much time
- time (h) ≈ energy added (kWh) ÷ average power over that range (kW)
- 10 → 80%: 0.70 × 77 = 53.9 kWh at ≈ 130 kW average → 0.41 h ≈ 25 min
- 80 → 100%: 0.20 × 77 = 15.4 kWh at ≈ 26 kW average → 0.59 h ≈ 35 min
Three and a half times the energy, in less time. This is the arithmetic behind every 10–80% charging claim in a manufacturer's specification.
Worked example: two stops or one long one
- Route requiring 100 kWh of charging77 kWh packYour input
- Option A: charge 10→100% once, then 10→40%60 min + 12 min = 72 minIllustrative model
- Option B: charge 10→80% twice25 min + 25 min = 50 minIllustrative model
- Difference22 minutes savedCalculated result
What else moves the curve
Battery temperature. The single largest factor. A cold pack may accept a third of its rated peak. Vehicles with route-based preconditioning warm the battery on the way to a charger, which is why the same car can post wildly different session times.
Charger capability and sharing. A 350 kW cabinet split between two vehicles may deliver half its rating to each. The car cannot exceed what the charger supplies, whatever the curve says.
Pack architecture. 800 V systems generally sustain high power further up the curve than 400 V systems, because they achieve the same power at lower current and therefore less heat.
State of health. An older pack with higher internal resistance tapers earlier and runs hotter doing it.
Estimate a charging session
Enter pack size, starting and target state of charge, and charger power. For AC charging the estimate is reliable; for DC fast charging treat it as a floor, because the taper makes real sessions longer.
Open the EV charging time calculatorAssumptions and limitations
- The power curve is an illustrative model, not measured data from a specific vehicle. Manufacturers rarely publish full curves, and independent measurements vary with temperature and charger.
- Session-time examples assume a preconditioned battery and an uncontended charger. Both assumptions fail regularly in real use.
- Our charging time calculator models constant power and therefore understates DC fast-charging sessions that extend above roughly 60% state of charge.
Sources
- IEC 61851 — Electric vehicle conductive charging system — International Electrotechnical Commission
Supports: Charging power is commanded by the vehicle's battery management system, not by the charger.
- Battery test manual for electric vehicles — U.S. Department of Energy / Idaho National Laboratory
Supports: Charge acceptance of lithium-ion cells declines as state of charge and cell voltage rise.
Related guides
 EV chargingAC vs DC chargingYou pay for energy at the wall. Your car reports energy in the pack. Those are never the same number.
 EV chargingEV efficiency unitsThree units, three regions, one physical quantity — and one of them runs the wrong way round.
 BatteriesDepth of dischargeDepth of discharge is the difference between the number on the spec sheet and the energy you are allowed to take out.