What is the best angle for solar panels?
Enter your city or ZIP for a recommended tilt and direction, then see what your own roof gives up. There is an angle that maximises the year, an angle that favours winter, and the angle your roof already has — and the gap is usually smaller than people expect.
Published 23 August 2026 · Published by SnapEnergyLab. Methodology and default assumptions are documented separately.
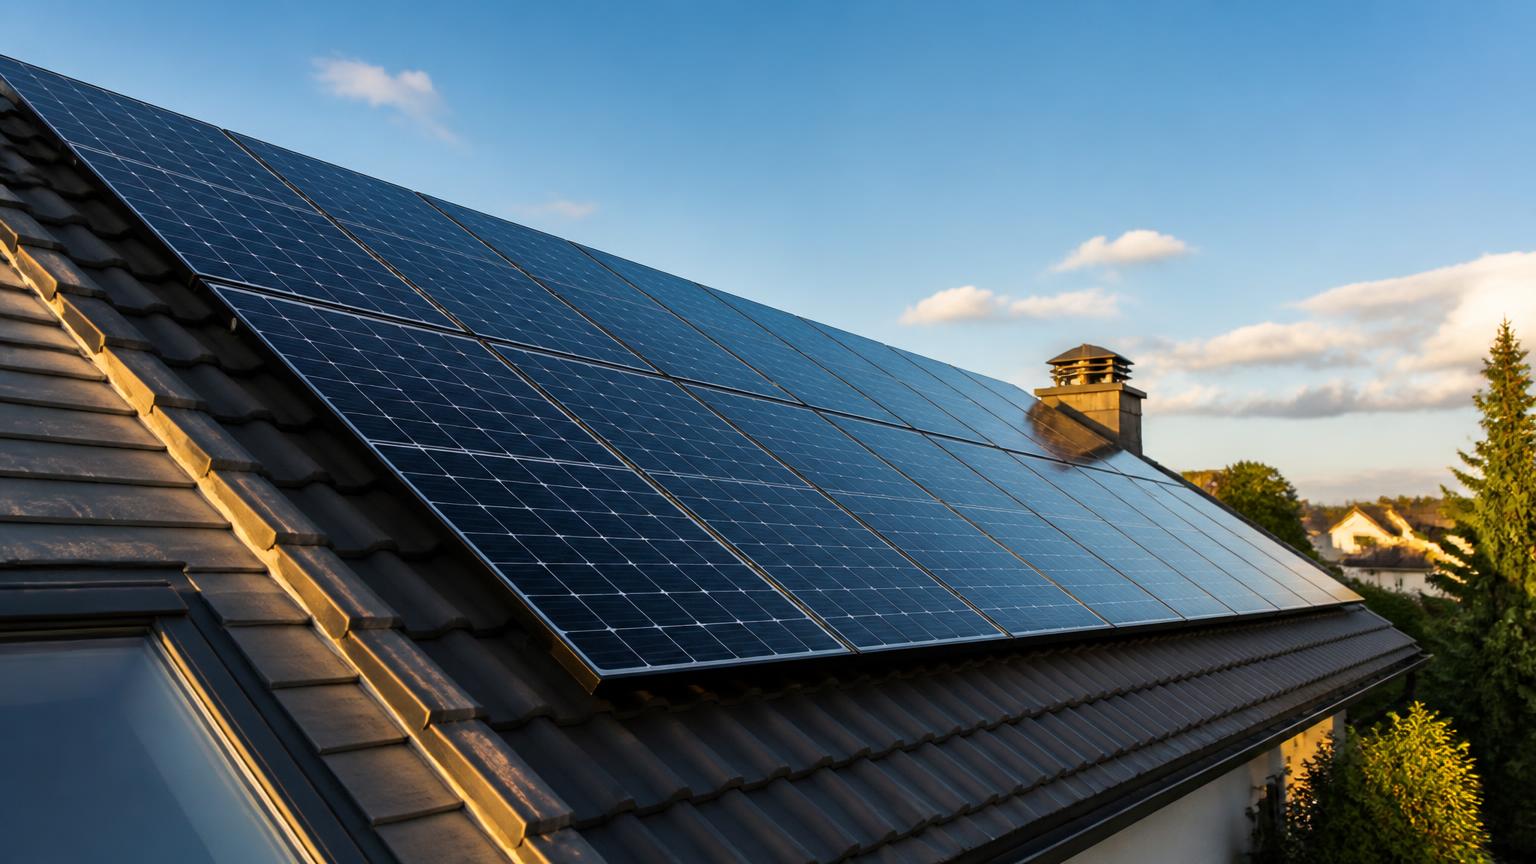
Quick answer
For annual production, tilt the array roughly at your latitude, a little flatter in cloudy climates, and face it toward the equator — south in the northern hemisphere, north in the southern. In most of Europe and the United States that lands somewhere between 25° and 45° — the table below shows the modelled optimum for a range of latitudes.
The more useful answer is that the optimum is flat. Being 10° off the ideal tilt typically costs one or two percent of the year’s output. Orientation matters more than tilt, shading matters more than both, and on a pitched roof you are usually keeping the angle the builder gave you anyway.
- Rule of thumb
- ≈ latitude
- Site default
- Typical optimum, London (52°)
- 42°
- Calculated result
- Typical optimum, Phoenix (33°)
- 28°
- Calculated result
- Cost of being 10° off in tilt
- ≈ 1.4% of the year
- Calculated result
Solar panel angle calculator
Enter a city, ZIP or postcode (or pick a reference latitude) to get a recommended year-round tilt and direction. Then set your actual roof and see what its geometry gives up against that optimum. Results are relative — they answer “what angle?” and “how much worse is this roof?”, not “how many kWh?”.
Only latitude is used: the recommended tilt comes from an empirical latitude regression, not from local weather data, so a site-specific model may differ by a few degrees.
0° is flat, 45° is a steep pitched roof.
180° faces the equator (due south in the northern hemisphere, due north in the southern). 90° is east, 270° is west.
These figures are deliberately relative: the reference case is the same array facing the equator at 42° tilt, and everything is expressed as a share of it. The orientation term is a first-order geometric de-rate, not a ray-traced simulation, so use it to compare roof options — for an absolute kWh figure for your own address, use the solar output calculator, which is the site’s single authoritative production model.
Two angles, not one
A panel’s position is described by two numbers, and people routinely conflate them.
Tilt is the angle between the panel and the horizontal. 0° is flat on its back facing straight up; 90° is vertical, like a facade. Tilt decides how well the array matches the sun’s height in the sky, which changes with the season.
Azimuth is the compass direction the panel faces. 180° is due south, 90° due east, 270° due west. Azimuth decides which part of the day the array is aimed at.
Energy arriving at the panel scales with the cosine of the angle between the sunlight and the panel’s perpendicular. That single relationship explains everything below — including why the penalty near the optimum is so small: the cosine curve is almost flat at its peak.
- irradiance on panel ≈ direct beam × cos(angle of incidence) + diffuse sky
- annual yield = system kW × specific yield × orientation factor × (1 − losses)
- at 52°N the modelled optimum is 42°, and every factor below is measured against it:
- 42° facing the equator = 1.000
- 35° facing the equator = 0.993
- 35° facing due east = 0.752
- 0° (flat) = 0.769
The orientation factor is a first-order geometric de-rate used by our solar engine for relative comparisons. Both penalties follow the cosine of the angular error, so the surface is flat near the peak and steepens further out, and the azimuth term scales with sin(tilt) because a flat array has no compass direction. It captures the shape of the trade-off, not site-specific irradiance — the optimum it is measured against moves with latitude.
Latitude as the starting point
The classic rule — set tilt equal to latitude — comes from wanting the panel perpendicular to the sun at midday averaged over the year. It works, but it slightly overshoots at higher latitudes, where more of the annual energy arrives in summer when the sun is high, and where a larger share of the light is diffuse and arrives from the whole sky rather than from one direction. A flatter panel sees more sky.
| Roughly at this latitude | Latitude | Best annual tilt | Winter-biased | Summer-biased |
|---|---|---|---|---|
| Phoenix / Seville | 33°N | 28° | 43° | 13° |
| San Francisco / Athens | 37°N | 31° | 46° | 16° |
| New York / Madrid | 41°N | 34° | 49° | 19° |
| Seattle / Milan | 46°N | 38° | 53° | 23° |
| London / Amsterdam | 52°N | 42° | 57° | 27° |
| Oslo / Stockholm | 59°N | 46° | 61° | 31° |
What being wrong actually costs
This is the part that changes decisions. There is no single universal optimum to be wrong about: the reference angle moves with latitude, so the first table measures each latitude against its own modelled optimum rather than against one fixed number.
| Latitude | Local optimum | 0° | 15° | 25° | 35° | 45° | 60° |
|---|---|---|---|---|---|---|---|
| Phoenix / Seville (33°) | 28° | 89% | 98% | 100% | 99% | 96% | 86% |
| San Francisco / Athens (37°) | 31° | 87% | 97% | 100% | 100% | 97% | 89% |
| New York / Madrid (41°) | 34° | 85% | 95% | 99% | 100% | 98% | 91% |
| Seattle / Milan (46°) | 38° | 81% | 93% | 98% | 100% | 99% | 93% |
| London / Amsterdam (52°) | 42° | 77% | 90% | 96% | 99% | 100% | 96% |
| Oslo / Stockholm (59°) | 46° | 73% | 87% | 94% | 98% | 100% | 97% |
Share of that latitude’s own modelled optimum, equator-facing, from our solar engine. Relative figures only — no location-specific irradiance is involved.
Read across any row and the middle of the range is broad: at mid latitudes everything from about 25° to 45° sits within a few per cent of the best case, which is why an ordinary pitched roof rarely needs correcting. Read down a column and the same tilt is excellent in Phoenix and mediocre in Oslo — a 25° roof is near-perfect at 33° latitude and gives up real output at 59°.
Turning the array away from the equator costs more, and it costs more the steeper the array is. A flat array has no compass direction at all, so azimuth only starts to matter once there is a pitch:
| Tilt | Equator-facing (180°) | 45° off (SE / SW) | 90° off (E / W) | 135° off (NE / NW) |
|---|---|---|---|---|
| 0° | 77% | 77% | 77% | 77% |
| 15° | 90% | 87% | 79% | 72% |
| 25° | 96% | 91% | 78% | 66% |
| 35° | 99% | 92% | 75% | 58% |
| 45° | 100% | 91% | 70% | 49% |
| 60° | 96% | 85% | 59% | 34% |
Reference case: 52°N, where the modelled optimum is 42° facing the equator. An east or west roof gives up real output, though it shifts production toward morning or evening, which can suit a time-of-use tariff or a household that uses power after work.
Worked example: is it worth tilting panels up on a flat roof?
- Location52°N — modelled optimum 42°, equator-facingYour input
- Flat mounting (0°)factor 0.769Calculated result
- Tilted frames (35°, equator-facing)factor 0.993Calculated result
- Relative gain from tilting0.993 ÷ 0.769 − 1Calculated result
- Panels lost to row spacingtilted frames typically fit 25–35% fewer panels on the same flat roofSite default
The comparison is per panel, and that is the catch: on a flat roof the calculation is rarely just about energy per panel. Tilted frames need ballast or penetrations, they need row spacing so panels do not shade each other, and that spacing can cut the number of panels that fit by a third or more. Fitting more flat panels frequently beats fitting fewer well-angled ones. Flat mounting also soils faster, because rain does not run the dust off.
Practical cases
A normal pitched roof
Fit flush to the pitch. Standoff frames that tilt panels away from the roof plane add cost, wind load and visual bulk for a gain usually inside the modelling error. Most residential roofs sit between 20° and 45°, which is already in the flat part of the curve.
An east–west roof
Split the array across both faces rather than crowding one. Total annual output is a little lower than a south array, but the production curve is wider and flatter, which raises self-consumption — and self-consumed kWh are usually worth more than exported ones.
A north-facing roof (northern hemisphere)
Generally not worth it at mid and high latitudes. Check the other roof faces, ground mounting, or a shed or garage first.
Trackers and seasonal adjustment
Single-axis tracking adds real output but also cost, moving parts and maintenance; it is a utility and ground-mount technology, not a rooftop one. Manually re-tilting a domestic array twice a year gains a few percent, and almost nobody keeps doing it after the first winter.
Model your own array
Search your city, set system size, tilt, orientation and system losses, and get modelled annual and monthly production from long-term data for your own coordinate — with the source, dataset and assumptions shown alongside the answer.
Open the solar output calculatorWorking backwards from your electricity use
If you know how much electricity you use per year, size the array against the share you want to cover — the same engine, driven from the other end.
Size an array from your annual kWhAssumptions and limitations
- Every percentage on this page is relative — the share of a latitude's own modelled optimum. Nothing here is an absolute kWh figure; the solar output calculator is the site's only authoritative production model.
- The orientation factor is a first-order geometric approximation, not a ray-traced irradiance model. Both terms follow the cosine of the angular error, which reproduces the flat peak and steep tails of the real yield surface, but it is used to show the shape and size of the trade-off, not to certify a design.
- Optimal tilt figures come from a latitude regression. A site-specific model (PVGIS, PVWatts) that uses local irradiance and cloud data will differ by a few degrees.
- No shading is modelled anywhere on this page. Shading is normally the largest single source of real-world underperformance.
- Snow shedding, wind loading, ballast limits, row spacing and mounting cost are engineering constraints that frequently override the energy optimum on real roofs.
- Diffuse-light behaviour varies by climate. Cloudier locations favour slightly flatter arrays than the table suggests; very clear high-altitude sites favour slightly steeper ones.
- Southern-hemisphere readers should mirror every azimuth: equator-facing means due north, and 180° in the tables becomes 0°.
Sources
- PVWatts Calculator — technical reference and default assumptions — National Renewable Energy Laboratory (NREL)
Supports: The convention of latitude-based tilt, the 14% system-loss default and the modelling approach behind annual yield estimates.
- Photovoltaic Geographical Information System (PVGIS) — European Commission, Joint Research Centre
Supports: Optimum tilt and azimuth per location, and the shape of the annual yield surface around that optimum.
- Optimum tilt of solar panels — empirical latitude regressions — Charles R. Landau
Supports: The piecewise latitude-to-tilt approximation used by the explorer on this page.
Related guides
 SolarPeak sun hoursA peak sun hour is not an hour of daylight. It is a unit of energy pretending to be a unit of time.
 SolarRated vs real outputThe rating on the panel is measured in a laboratory at conditions your roof almost never sees.
 SolarWinter vs summerAnnual production is a comforting number. The monthly shape is the one that decides whether solar covers your winter bill.