Why solar panels never produce their rated power
The rating on the panel is measured in a laboratory at conditions your roof almost never sees.
Published 23 August 2026 · Published by SnapEnergyLab. Methodology and default assumptions are documented separately.
Quick answer
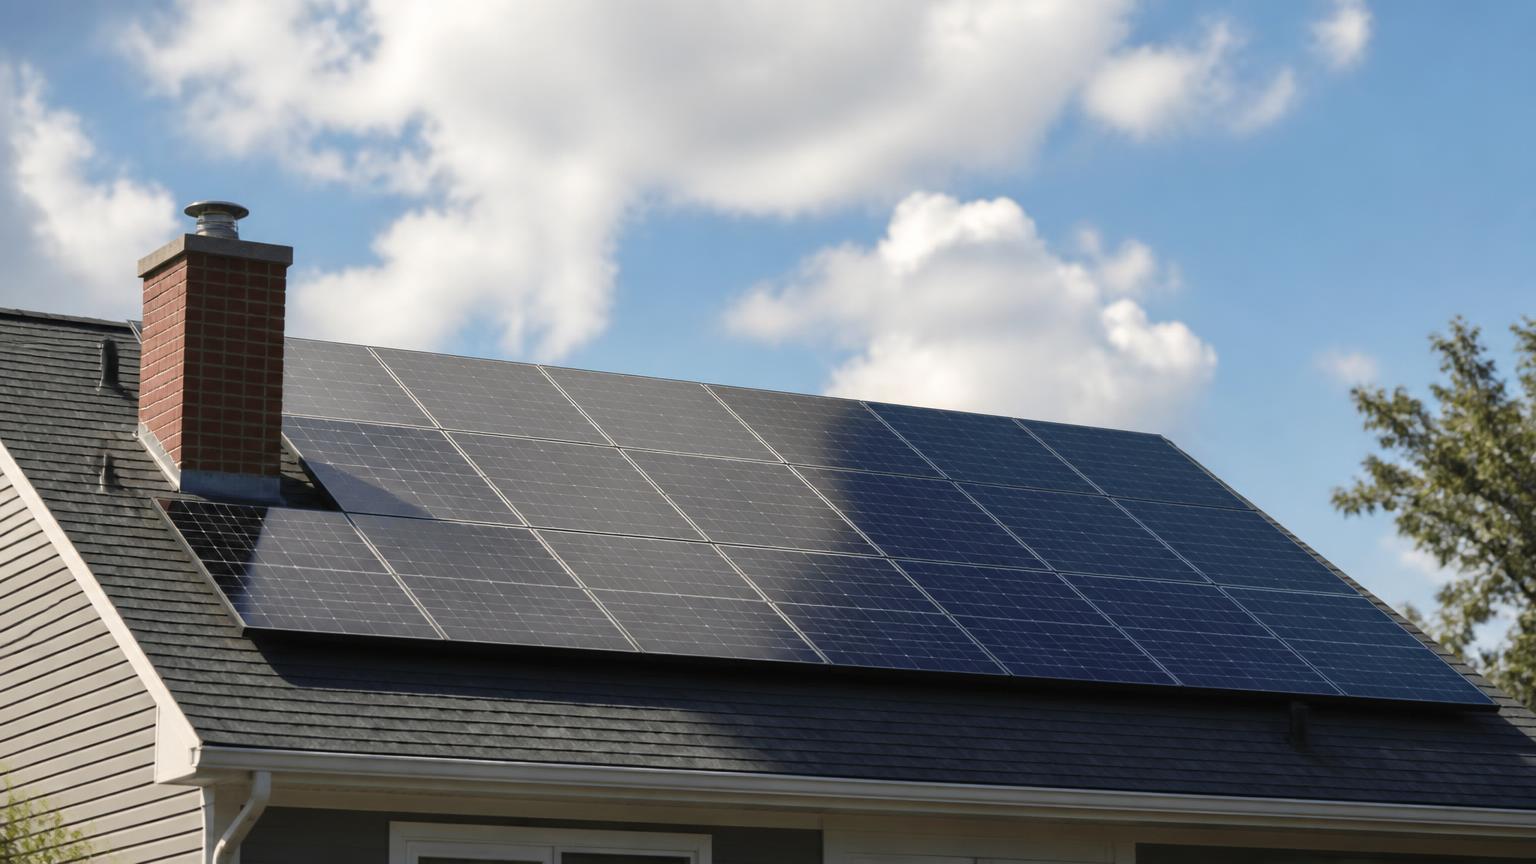
A module’s rating is measured under standard test conditions: 1,000 W/m² irradiance and a cell temperature of 25 °C. Those two conditions rarely occur together on a roof — bright enough for full irradiance usually means the cells are far hotter than 25 °C.
Losses then stack multiplicatively through temperature, inverter, soiling, wiring, mismatch and shading. The combined result is the performance ratio, typically 0.80–0.85 for a good unshaded installation.
- Rated array
- 6.0 kWp
- Your input
- Realistic summer peak
- 4.6 – 5.2 kW
- Calculated result
- Performance ratio
- 0.80 – 0.85
- Site default
Standard test conditions are a laboratory, not a roof
STC exists so that modules from different manufacturers can be compared on identical terms. It was never intended as a prediction of field output, and treating the nameplate as one is the single most common source of disappointment with a new solar installation.
The temperature term is the biggest routine offender. Silicon PV output falls by roughly 0.3–0.4% for every degree the cell sits above 25 °C. On a still, sunny July afternoon, cell temperature of 55–65 °C is normal, which costs 10–15% on its own — at the exact moment irradiance is highest.
Some manufacturers also publish NOCT or NMOT ratings, measured at more realistic operating temperatures. Where a datasheet gives one, it is a better basis for expectation than the STC figure.
The loss stack
| Loss | Typical range | Notes |
|---|---|---|
| Cell temperature above 25 °C | 5 – 12% | Output falls roughly 0.3–0.4% per °C above the test condition. A dark roof in summer can put cells 30 °C above air temperature. |
| Inverter conversion | 2 – 5% | DC to AC conversion, worst at very low input power. |
| Soiling | 1 – 5% | Dust, pollen, salt and bird droppings. Higher in dry dusty climates and near trees. |
| DC and AC wiring | 1 – 3% | Resistive losses, larger on long cable runs. |
| Module mismatch and tolerance | 1 – 3% | Strings run at the current of the weakest module. |
| Shading | 0 – 30%+ | Highly site-specific. Optimisers or microinverters reduce, but do not remove, the penalty. |
| Degradation | 0.3 – 0.7% per year | Cumulative. A 20-year-old array typically retains 85–90% of its original rating. |
| Snow and downtime | 0 – 5% | Regional; concentrated in a few months rather than spread evenly. |
- performance ratio = (1 − L₁) × (1 − L₂) × … × (1 − Lₙ)
- example: 0.92 × 0.97 × 0.98 × 0.98 × 0.98 = 0.840
- AC output (kW) = rated kWp × (irradiance ÷ 1000) × performance ratio
Losses multiply, they do not add. Five 3% losses cost 14.1%, not 15% — a small difference here, but the distinction matters once shading pushes one term high.
Worked example: peak output on a hot clear day
- Rated array6.0 kWpYour input
- Irradiance on the plane950 W/m²Illustrative model
- Irradiance factor950 ÷ 1000 = 0.95Calculated result
- Cell temperature58 °C, i.e. 33 °C above STCIllustrative model
- Temperature loss at 0.35%/°C33 × 0.0035 = 11.6%Calculated result
- Other losses combined≈ 8%Site default
- AC output6.0 × 0.95 × 0.884 × 0.92 = 4.64 kWCalculated result
Inverter clipping is a design choice, not a fault
Many systems are deliberately built with more DC panel capacity than AC inverter capacity — a 6 kWp array on a 5 kW inverter, for instance. Because the array rarely reaches its rating, the inverter is busy for more hours of the year and the small number of clipped peak hours costs less than a larger inverter would.
If your monitoring shows output flat-topping at exactly the inverter rating on the brightest days, that is the design working, not a failure. The annual energy lost to clipping in a sensibly sized system is usually under 2%.
Set your own loss assumptions
System losses are an editable input, not a hidden constant. Change them and watch the modelled annual figure move, so you can see how much of a quote’s optimism sits in that one number.
Open the solar output calculatorAssumptions and limitations
- Loss ranges are typical published values used in PV modelling, not measurements of your installation. Shading in particular is entirely site-specific and can dominate everything else.
- The worked example uses illustrative irradiance and cell temperature values chosen to show the arithmetic, not observed data from a specific location or day.
- Temperature coefficients vary by module technology. Check the datasheet value for your modules rather than assuming 0.35% per °C.
Sources
- IEC 61215 — Terrestrial photovoltaic modules, design qualification and type approval — International Electrotechnical Commission
Supports: Standard test conditions of 1,000 W/m², 25 °C cell temperature and AM1.5 spectrum used for module ratings.
- PVWatts Calculator — system loss defaults — U.S. National Renewable Energy Laboratory
Supports: Typical loss categories and default magnitudes used in PV production modelling.
Related guides
 SolarPeak sun hoursA peak sun hour is not an hour of daylight. It is a unit of energy pretending to be a unit of time.
 SolarWinter vs summerAnnual production is a comforting number. The monthly shape is the one that decides whether solar covers your winter bill.
 ElectricityNameplate vs actualThe label states a maximum. Duty cycle turns it into a number you can put on a bill.