Heat pump efficiency vs outdoor temperature
Efficiency falls exactly when you need heat most. That is the whole design problem in one sentence.
Published 23 August 2026 · Published by SnapEnergyLab. Methodology and default assumptions are documented separately.
Quick answer
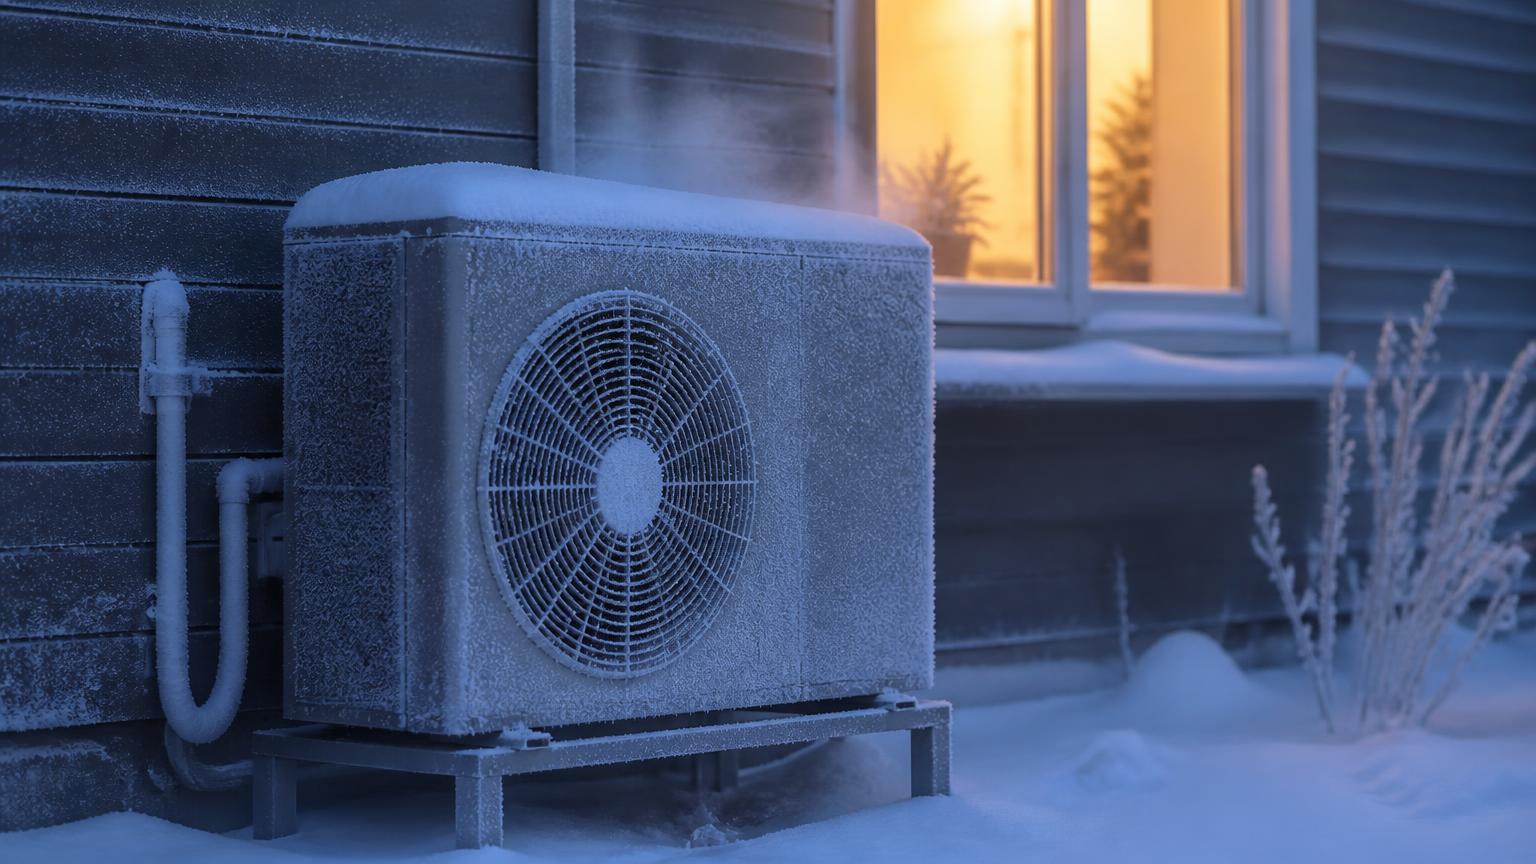
A heat pump moves heat from outdoor air to your home. The colder it is outside, the further it has to lift that heat, and the more electricity each unit of delivered heat costs.
Efficiency therefore falls exactly when heat demand rises. Both effects compound: on the coldest day of the year you need perhaps three times the heat at roughly half the efficiency.
- COP at +7 °C
- ≈ 4.3
- Illustrative model
- COP at −10 °C
- ≈ 2.5
- Illustrative model
- Electricity for the same heat
- 1.7× more
- Calculated result
Why the temperature lift sets the limit
The theoretical ceiling on any heat pump is set by thermodynamics: efficiency depends on the ratio of the absolute temperatures involved, and it falls as the gap between source and delivery widens. Real machines reach 40–55% of that ideal, but they follow the same shape.
Two temperatures matter, not one. Lowering the flow temperature is as powerful as raising the outdoor temperature — a system delivering 35 °C water performs dramatically better than the same unit delivering 55 °C, in every weather condition. This is why radiator sizing and underfloor heating dominate heat pump design discussions.
- ideal COP = T_delivery ÷ (T_delivery − T_source) [temperatures in kelvin]
- at 7 °C outdoor, 35 °C flow: 308 ÷ (308 − 280) = 11.0 ideal
- at −10 °C outdoor, 35 °C flow: 308 ÷ (308 − 263) = 6.8 ideal
- real COP ≈ ideal × 0.40 to 0.55
The ideal figure is an upper bound no machine reaches. Its value here is the ratio: the theoretical ceiling drops by about 38% between those two conditions, and real machines drop by a similar proportion.
Show the plotted values
| Outdoor temperature | COP |
|---|---|
| -20° | 1.9 |
| -15° | 2.2 |
| -10° | 2.5 |
| -5° | 3 |
| 0° | 3.4 |
| 5° | 4 |
| 7° | 4.3 |
| 12° | 4.9 |
Defrost: the loss that does not appear on a datasheet curve
Between roughly +6 °C and −5 °C with humid air, moisture freezes on the outdoor coil. The unit periodically reverses to melt it, which consumes energy and delivers no heat to the house during the cycle.
Defrost typically costs 5–15% of seasonal output, and it is worst in damp mild weather rather than in deep cold — dry air at −15 °C deposits little frost. This is why a heat pump can perform relatively better on a crisp cold day than on a foggy day just above freezing.
Worked example: the same house on two days
- Mild day, +7 °C outdoorheat demand 30 kWhIllustrative model
- COP at +7 °C4.3Illustrative model
- Electricity used30 ÷ 4.3 = 7.0 kWhCalculated result
- Cold day, −10 °C outdoorheat demand 85 kWhIllustrative model
- COP at −10 °C2.5Illustrative model
- Electricity used85 ÷ 2.5 = 34.0 kWhCalculated result
Cold-climate performance is a real thing
Air-source heat pumps operate successfully in Nordic and northern North American climates, and the reason is engineering rather than optimism: enhanced vapour injection, variable-speed compressors and larger heat exchangers keep useful output down to −25 °C or below.
What changes in a cold climate is the design margin. Systems are sized so that the compressor still meets demand at the design outdoor temperature, with a supplementary heat source — usually an immersion element at COP 1 — covering only a handful of extreme hours a year. If that element runs for weeks rather than hours, the system is undersized and the season’s running cost reflects it.
Compare against resistance heating at your own COP
See what the same delivered heat costs from a heat pump and from a resistance heater, with the efficiency figure as an input you control rather than an assumption we make for you.
Open the heat pump comparisonAssumptions and limitations
- The COP curve is an illustrative model of typical modern air-source behaviour, not a measurement of any specific product. Use the manufacturer's performance table at your design flow temperature.
- Defrost energy, auxiliary heating and circulation pump consumption are excluded from the curve and all reduce delivered performance.
- Heat demand figures in the worked example are illustrative and depend entirely on the building's heat loss, not on the heat pump.
- Ground-source and water-source systems see a far more stable source temperature and do not follow this curve.
Sources
- EN 14511 — Air conditioners, liquid chilling packages and heat pumps: testing and rating — European Committee for Standardization
Supports: Rated COP is measured at defined source and flow temperatures, conventionally 7 °C air and 35 °C flow.
- Electrification of Heat Demonstration Project — performance analysis — Energy Systems Catapult
Supports: Measured in-situ heat pump COP against outdoor temperature across a heating season.
Related guides
 HeatingCOP vs SCOPOne is a measurement at a single favourable operating point. The other averages a whole heating season.
 HeatingHeat pump running costRunning cost is heat demand divided by seasonal efficiency, multiplied by your electricity price. Every disagreement is about one of those three numbers.
 SolarWinter vs summerAnnual production is a comforting number. The monthly shape is the one that decides whether solar covers your winter bill.